
Discover the latest developments, statistics, trends, and forecasts for the housing market in Amsterdam North in 2025.
In Amsterdam North, the average price per square meter has risen by 6.2% since the low point in Q4 2023.
The housing market in Amsterdam North continues to evolve, and the latest figures from Q4 2024 paint a mixed picture. The average price per square meter continues to rise, but the number of transactions is falling, and homes are staying on the market longer. What do these developments mean? We’ll walk you through the key figures and trends from this past quarter.
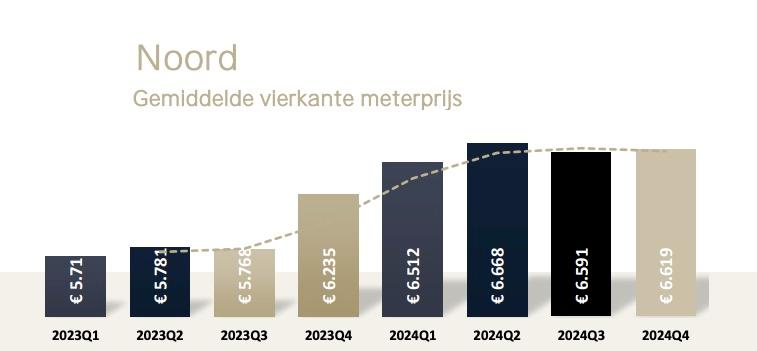
Average price per square meter continues to rise
The average price per square meter in Amsterdam North rose to €6,619 in Q4 2024. This represents an increase compared to Q3 2024 (€6,591) and a clear rise since the low point in Q4 2023 (€6,235). Within the ring road, the average price per square meter was €9,213, meaning prices within the ring road are significantly higher than the average in Noord.
Average transaction price falls slightly within the ring
The average transaction price in Amsterdam North was €581,981 in Q4 2024. This represents a slight increase compared to Q3 2024, when the average transaction price was €569,222.
Within the Ring, we see a slight decline in transaction prices in Q4 compared to Q3 2024. The average transaction price here fell from 728,355 to 727,549.
Although the average price per square meter has risen within the ring road, the decline in the average transaction price may indicate that more smaller or less expensive homes were sold within the ring road this quarter than in previous quarters.
Number of home sales is declining
The number of home sales in Amsterdam Noord fell to 189 in Q4 2024, compared with 227 in Q3 2024. The combination of a declining number of sales and a rising price per square meter suggests that demand for homes in Noord remains high, but that there is less supply available.
Homes are staying on the market a little longer
The average time on the market for homes in Amsterdam North rose to 42 days in Q4 2024, compared to 40 days in Q3 2024. This means that homes are staying on the market longer before they are sold. This may indicate that buyers are becoming more selective and taking more time before making a decision, possibly due to rising mortgage rates and higher prices.
Bidding wars are on the rise
Unlike many other parts of the city, the average overbid percentage in Amsterdam North continued to rise slightly in Q4 2024. In Q3 2024, buyers paid an average of 109.2% of the asking price, while this figure rose to 109.5% in Q4 2024.
What is striking is that the increase in overbidding for pre-war homes was the highest, rising from 109.9% to 112.6%. This increase suggests that homes in Noord remain popular and that there
Complete Report on Prices and Trends in the Amsterdam North Housing Market
Would you like to see all the details and analyses regarding the housing market in Amsterdam North for Q4 2024? Download the full quarterly report for an in-depth overview of average prices per square meter, transaction prices, time-to-sale, and overbids.
📥 Download the full report here: Quarterly Report
Do you have questions about the housing market in Noord, or would you like advice on buying or selling? Amsterdam at Home Makelaars is happy to help!
📞 Call us at 020-3080650
📧 Email us at info@makelaaramsterdam.nl
Stay up to date
Get the latest market figures and updates on the Amsterdam housing market delivered straight to your inbox every month.
Related articles


Looking to sell your home?
Discover how our data-driven approach can boost your sales results.
Contact us
