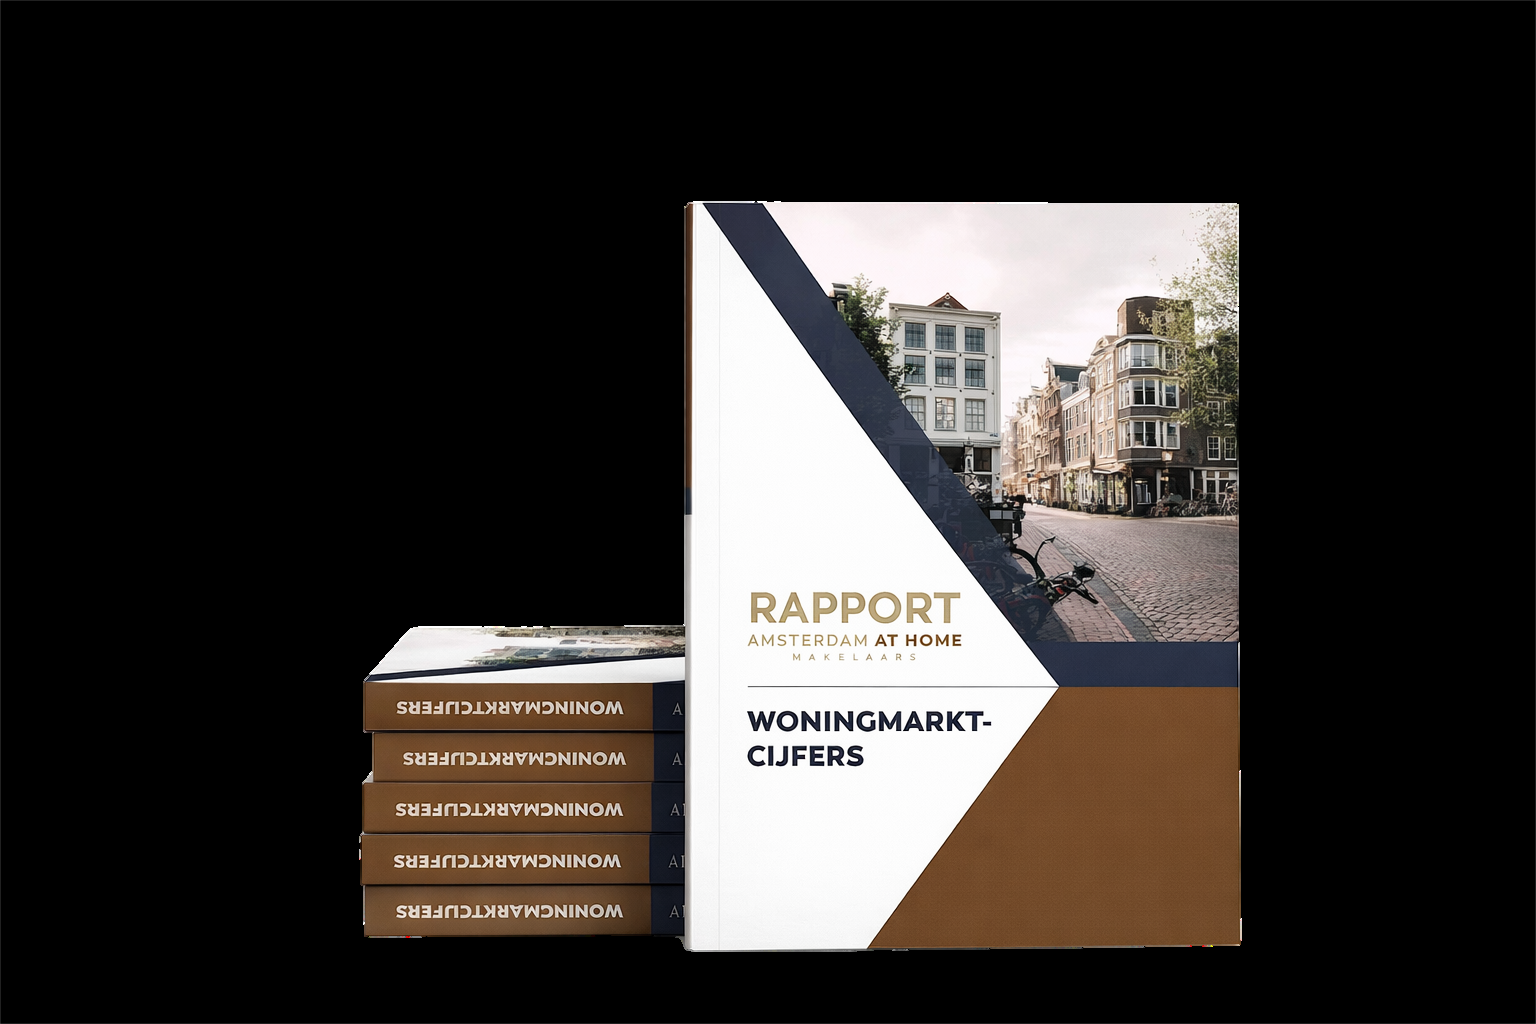
Amsterdam Housing Market


Market Data Amsterdam
Market Trends
- The average price per square meter is 4.7% higher than last year.
- The difference from the asking price is 2.3% on average.
- The market is gradually stabilizing, with fewer overbids.
- Fewer transactions indicate a slower market.

The 5 key pillars
Price per square meter
The average asking price per square meter provides insight into price trends for residential properties. The current figure for Amsterdam is shown above in the dashboard.
Transaction price
The average transaction price reflects what buyers actually pay. The difference from the asking price indicates how much bidding is still taking place.
Number of transactions
The number of home sales per year provides a good indication of market dynamics. Fewer transactions suggest a slower market and possibly greater caution among buyers.
Bid increment
The average percentage above the asking price indicates how competitive the market is. A higher percentage indicates more bidders per property.

Lead time
The average time on the market indicates how quickly homes are sold. A longer time on the market is typical of a cooling market; a shorter one is typical of a tight market.
Market trends
Always up to date
The Amsterdam housing market is constantly changing. We keep a close eye on all the trends so we can provide you with the best possible advice.
Key trends and
developments
The Amsterdam housing market is constantly changing. In addition to standard market figures, various other factors play a role in determining the value and marketability of homes.
- Trends by Housing Type: Differences between housing types and price ranges are growing. Apartments, single-family homes, and townhouses are not developing at the same pace. There are also significant differences within price ranges.
- Buyer Protection & Rental Market: Buyer protection limits the subletting of owner-occupied homes and safeguards the housing supply for residents. This can ease pressure on the rental market and influence the sales market.
- National Mortgage Guarantee: The National Mortgage Guarantee (NHG) limit for 2026 has been set at €470,000. This means that buyers can borrow up to this amount under NHG terms.
- New Construction & Nitrogen: New construction projects in Amsterdam are facing delays due to nitrogen regulations and grid congestion. This is limiting the supply of new homes and keeping pressure on the existing housing market.
- Interest Rates & Transaction Timelines: Higher interest rates are slowing down the market: buyers are being more cautious and taking more time, which is noticeably lengthening transaction timelines. The current figures are shown above in the dashboard.
- NVM Quality Standards: As an NVM real estate agent, we operate in accordance with strict codes of conduct and quality standards. We combine market data, local expertise, and personalized guidance.
Get our market report
Enter your information and receive the most recent quarterly report for your specific neighborhood in Amsterdam right away.